A Picture Paints a Thousand Words: Infographics for Authentic Learning in Undergraduate Students
Saw Hoon Lim and Rosa McCarty
Department of Biochemistry and Pharmacology, University of Melbourne
Frontiers in Biomedicine is a final-semester capstone subject for third-year Bachelor of Biomedicine students at the University of Melbourne. The subject takes an interdisciplinary approach to understanding established and emerging health challenges, encouraging students to consider the many factors that influence health and disease.
An important learning outcome is the ability to integrate information from different disciplines and perspectives into a clear, coherent explanation of a health issue.
One of the four major health topics explored in the subject is metabolic syndrome. This topic forms the basis of an assessment titled Writing for Your Audience, which challenges students to communicate scientific information effectively to different audiences.
Designing an Authentic Assessment
The assessment places students in a realistic professional scenario: they are asked to imagine that they have been employed to develop educational materials for the Victorian Government's Better Health Channel.
Their task is to prepare health information about metabolic syndrome for two distinct audiences: health practitioners and members of the general public.
The assignment consists of three connected tasks. Students develop communication materials appropriate to each audience and then reflect on the strategies they used to adapt the content, language and presentation.
The public-facing component had previously required students to submit a plain-text document. To encourage more engaging communication, this was redesigned as an infographic assignment.
Students were asked to create an accessible visual explanation of metabolic syndrome for a non-specialist audience, combining scientific accuracy with effective graphic design and concise language.
This approach was informed by educational research suggesting that creating infographics can increase engagement, promote deeper learning and strengthen students' ability to distil complex information for audiences without specialist knowledge (1,2).
To demonstrate the approach and immerse students in the activity, the assignment instructions were themselves presented as an infographic.
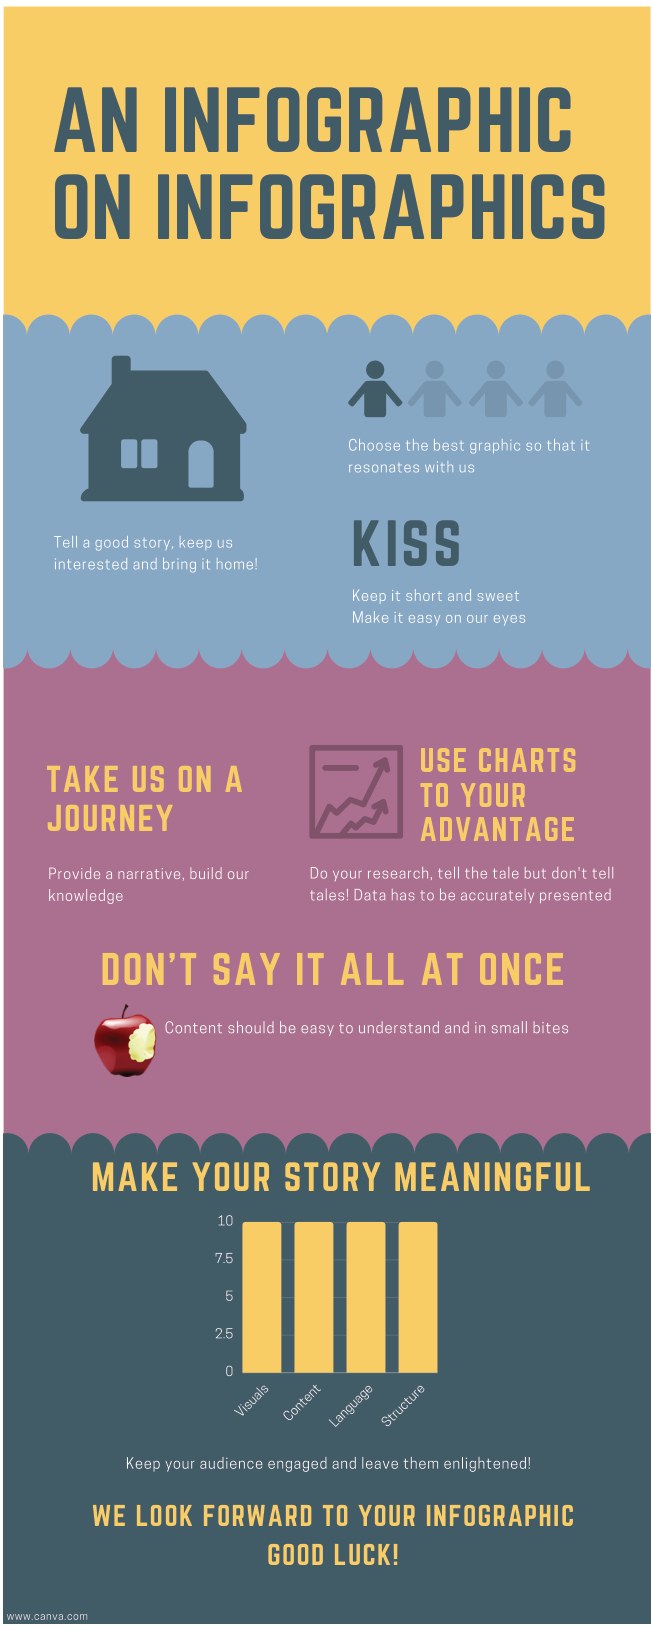
Fig. 1. Instructions on creating an infographic were delivered via an infographic.
Student Engagement and Learning
Students responded enthusiastically to the opportunity to present their learning through visual storytelling.
The resulting infographics demonstrated considerable creativity and attention to the needs of their intended audience. Students used illustrations, graphic elements and carefully selected information to communicate health messages in accessible and engaging ways.
The activity encouraged students to consider not only the scientific content of their work but also how information could be organised and presented to maximise understanding.
A particularly valuable learning outcome was the recognition that communicating less information, more effectively, can be preferable to overwhelming an audience with detail.
This principle is central to effective infographic design and the communication of complex scientific information to non-specialist audiences (3).
Student evaluations indicated that the redesigned assessment was well received.
Of the 124 students who responded to the evaluation survey, 73% rated the assignment as good or excellent, corresponding to scores of four or five on a five-point Likert scale.
Students also provided positive written feedback, reporting that they enjoyed the creative process and found the activity beneficial to their learning.
These results were particularly encouraging given the high academic achievement typically associated with the Bachelor of Biomedicine cohort.
Sharing Student Work Beyond the University
The quality of the submitted infographics inspired us to explore opportunities for sharing students' work beyond the classroom.
To reinforce the authentic nature of the assignment, we decided to approach several Australian health organisations that might find the student-produced resources useful for public education.
These organisations included the Australian Medical Association, the Heart Foundation and Diabetes Australia.
Rather than selecting the infographics solely through academic judgement, we introduced a student voting process.
Tutors first shortlisted the strongest submissions, after which students were invited to vote for their preferred designs in a People's Choice Award.
This approach served several purposes. It gave students a voice in recognising high-quality work, provided opportunities to learn from their peers and helped build a sense of community within the cohort.
A total of 118 votes were received. The three highest-ranked infographics were subsequently shared with the selected health organisations.
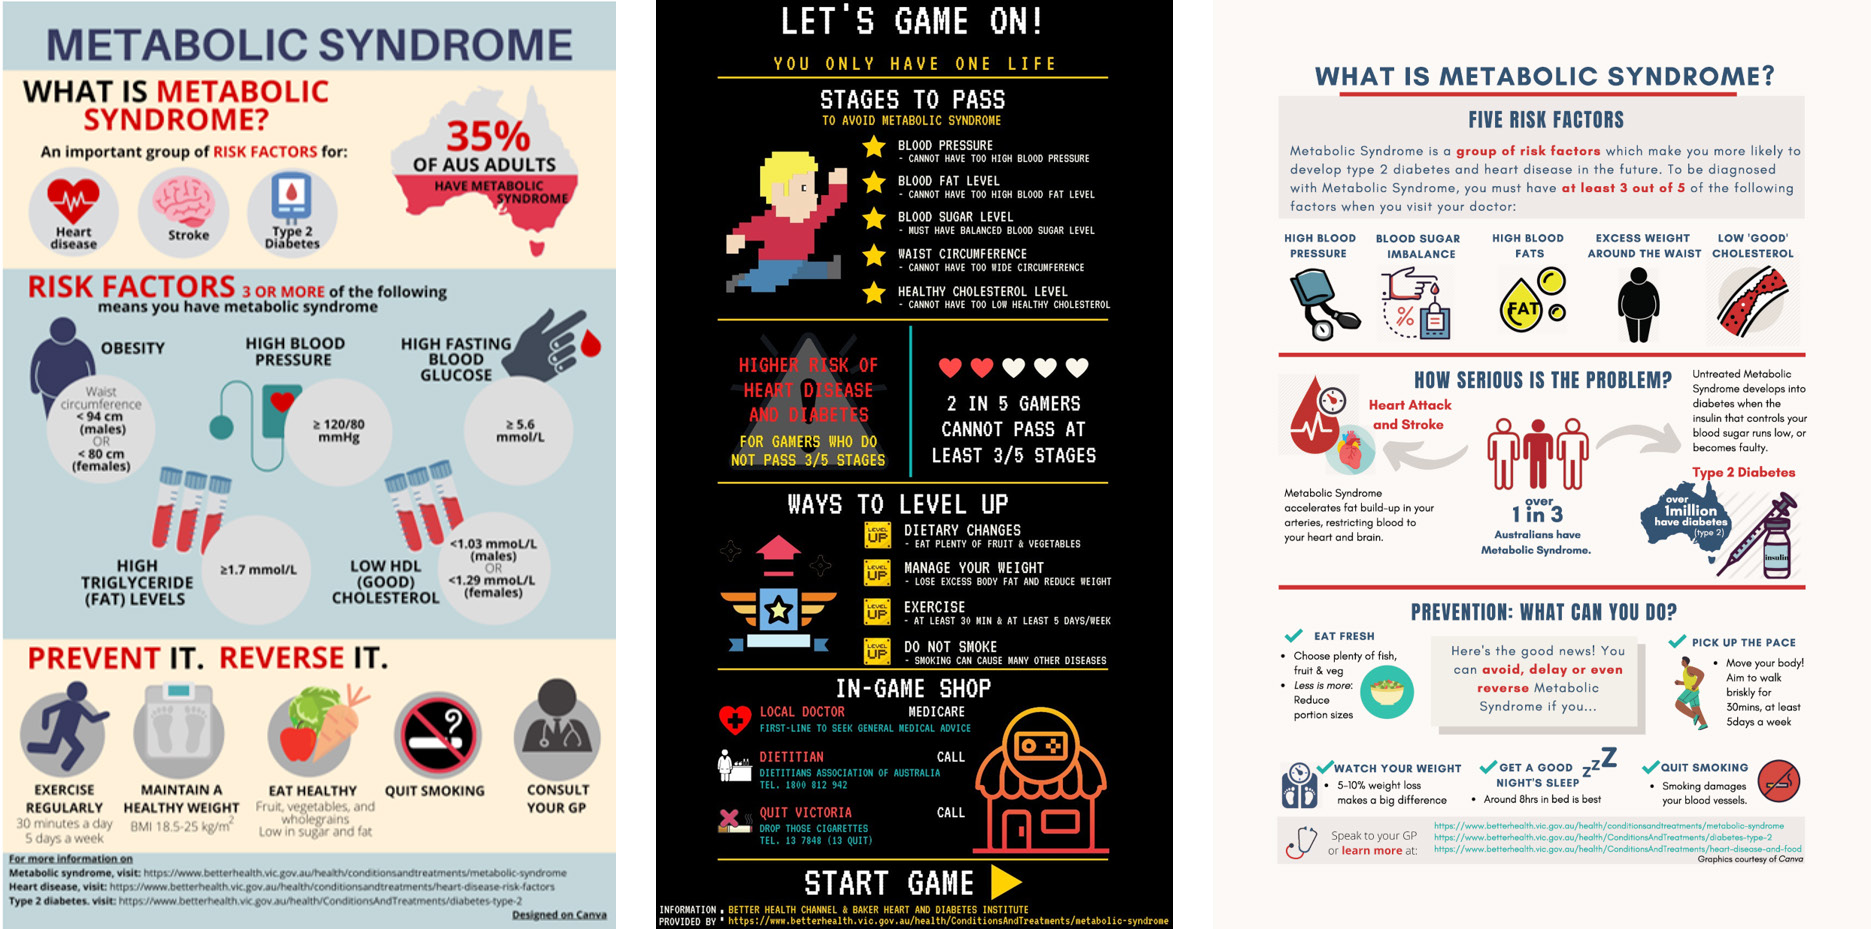
Fig. 2. The top three infographics as voted by students in Frontiers in Biomedicine, University of Melbourne, 2020.
Community Response and Outcomes
We were delighted to receive a positive response from Diabetes Victoria after sharing the student-created infographics.
The organisation recognised the value of presenting health information visually as a way of supporting public health literacy.
Diabetes Victoria also indicated that it would consider opportunities to use the students' infographics in the future.
This response provided a rewarding conclusion to the assignment and demonstrated the potential for student work to contribute to real-world health communication.
Through the process of researching, selecting and visually presenting information, students consolidated their understanding of metabolic syndrome while developing transferable communication skills.
The assignment also encouraged creativity, critical evaluation and consideration of audience needs, all of which are valuable capabilities for future biomedical professionals.
By creating educational materials with a potential audience beyond the university, students experienced a meaningful connection between their academic learning and the wider community.
Our experience demonstrates how infographics can provide an engaging and authentic assessment format that supports scientific understanding and develops students' ability to communicate complex concepts clearly.
References
- Mitchell DG, Morris JA, Meredith JM, Bishop N (2017). Chemistry infographics: experimenting with creativity and information literacy. In: Liberal Arts Strategies for the Chemistry Classroom. Chapter 7. American Chemical Society.
- Shanks JD, Izumi B, Sun C, Martin A, Byker Shanks C (2017). Front Public Health 5:315.
- Smiciklas M (2012). The Power of Infographics: Using Pictures to Communicate and Connect with Your Audiences. Que Publishing.
About the Authors

Dr Saw Hoon Lim is a Senior Lecturer and Teaching Specialist in the Department of Biochemistry and Pharmacology at the University of Melbourne.
sawhoon.lim@unimelb.edu.au

Dr Rosa McCarty is a Lecturer and Teaching Specialist in the Department of Biochemistry and Pharmacology at the University of Melbourne.
rmccarty@unimelb.edu.au
This article first appeared in the ASBMB Education Feature of Australian Biochemist , Vol 52 No 1, April 2021, pages 19–20.
ASBMB Membership Office
T +61 (03) 9907 8648
E asbmb@wsm.com.au
© 2026 ASBMB. All rights reserved.