Sketching Science: Graphical Abstracts as an Authentic Assessment
Katrina Binger1,2, Maria Demaria3 and Mark Wright3
1Department of Biochemistry and Chemistry, La Trobe University
2Department of Biochemistry and Molecular Biology, Monash University
3Department of Immunology, Monash University
Mind maps, concept maps, schematics and other visual representations have long been used by educators to simplify complex concepts and improve student learning and engagement (1). More recently, scientific journals have increasingly required authors to provide visual representations of their research, often in the form of graphical abstracts (2,3).
Graphical abstracts help readers identify relevant research and allow authors and publishers to increase the visibility of their work (4,5). This trend inspired us to design an authentic communication assessment for undergraduate science students that develops higher-order thinking skills and creativity.
How It Works
At La Trobe University, second-year biochemistry students enrolled in BCH2MBC study fundamental concepts of metabolic biochemistry. For their graphical abstract assessment, students select a research article from a provided collection focusing on central carbon metabolism.
Students read and interpret their chosen article before developing a graphical abstract that communicates its main scientific findings.
The assessment is supported by an instructional video that explains the task and uses annotated examples to demonstrate graphic design principles, including typography, colour and layout.
In-person workshops and additional support sessions allow academic staff to assist students with interpreting the research and provide informal feedback on their designs.
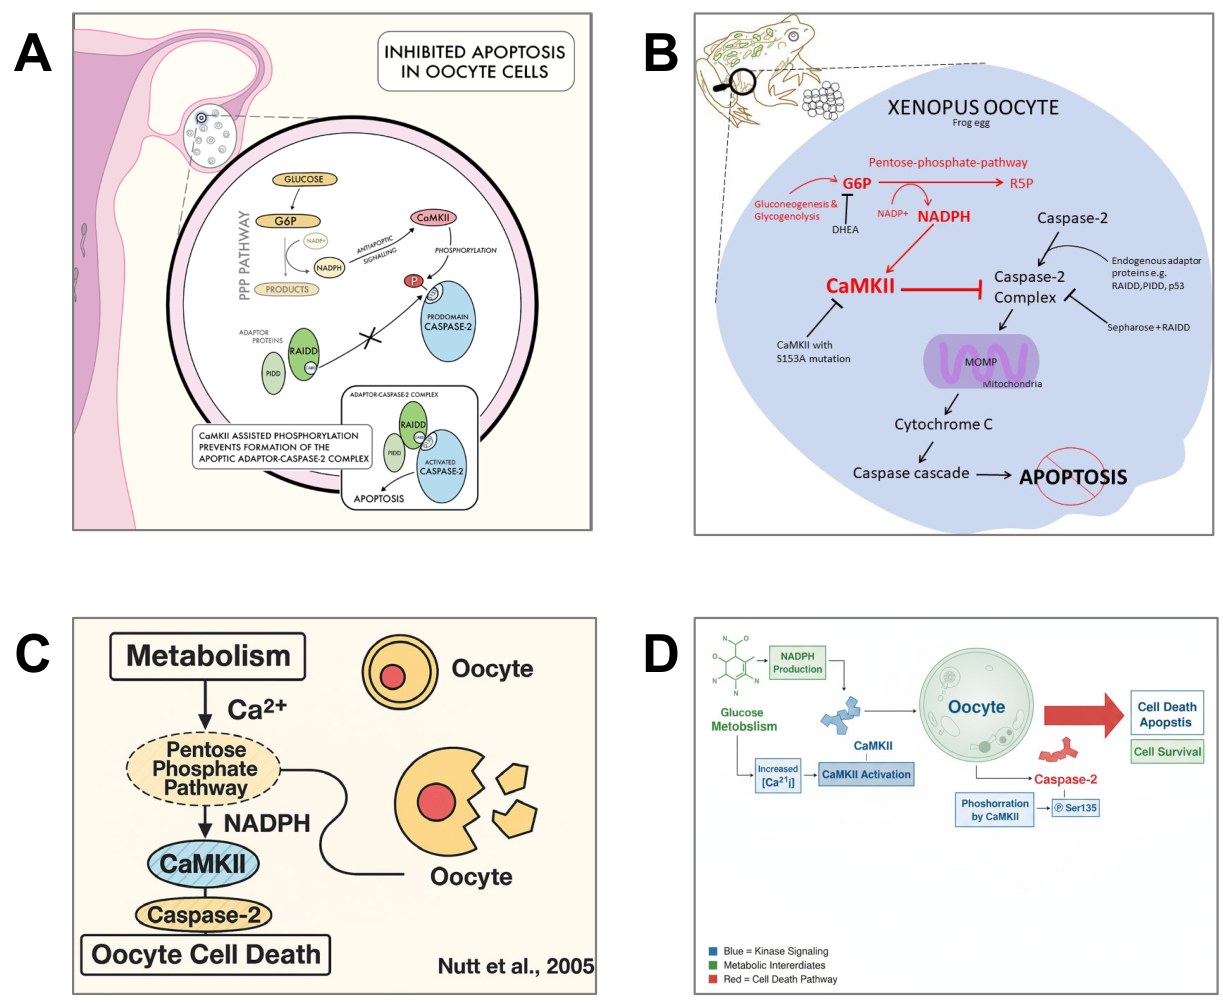
Fig. 1. Comparison of student-created and AI-generated graphical abstracts. Examples submitted by BCH2MBC students for the article 'Metabolic regulation of oocyte cell death through the CaMKII-mediated phosphorylation of caspase 2' by Nutt et al., 2005. Reproduced with permission from Tara Santamaria (a) and Sarah Hughes (b). AI-generated versions created using Microsoft Copilot (c) and Lovart (d).
Impact and Challenges
We analysed deidentified qualitative student feedback collected through routine subject evaluations using NVivo. Of the students who referred to the graphical abstract assignment, 64.5% expressed positive sentiments.
Frequently occurring words included 'understand', 'different' and 'creative', suggesting that students appreciated the opportunity to approach scientific learning differently.
From an academic perspective, marking is relatively efficient because each submission consists of a single image. However, evaluating the work requires a thorough understanding of the research article.
The greatest challenge is selecting suitable research papers. Articles must be accessible to second-year students, sufficiently detailed to support meaningful interpretation and free from existing graphical abstracts that students could reproduce.
We generally select older research articles published before graphical abstracts became common and avoid studies involving highly complex 'omics datasets or papers extensively illustrated in review articles.
Formative and/or Summative Assessment
In BCH2MBC at La Trobe University, the graphical abstract assignment is used as a summative assessment. However, this approach can also be used formatively to identify gaps in student understanding.
At Monash University, third-year immunology students enrolled in IMM3031 prepare a written News & Views article based on a provided research paper.
Since 2023, a graphical abstract has been incorporated as an early formative assessment component, weighted at 5% to encourage completion.
Students submit their graphical abstracts during weeks 4–5 and receive detailed feedback and marks. This allows educators to identify students who have misunderstood the research article and provide targeted support before the final written assessment.
Before implementation, 62% of students achieved a High Distinction or Distinction (greater than 70), while 15.4% received a Pass or Fail (less than 59).
Following the introduction of the graphical abstract, the proportion achieving a High Distinction or Distinction increased to 67.1%, while the proportion receiving a Pass or Fail decreased to 10.3%.
These results demonstrate the potential value of graphical abstracts in scaffolding larger written assessments and improving students' interpretation of scientific research.
Impact of Generative AI on This Assignment
The increasing availability of generative artificial intelligence has prompted educators to reconsider the design of open-ended assessments.
In our experience, generative AI tools have not been particularly effective at producing scientifically accurate graphical abstracts.
Our testing and the limited AI-generated student submissions observed suggest that these tools struggle with the higher-order cognitive skills required to synthesise research findings into accurate visual representations.
Common problems include biologically inaccurate cell structures, spelling errors and incorrect positioning or connections between molecules in biochemical pathways.
Examples of these limitations are illustrated in Figure 1, which compares student-created graphical abstracts with versions produced using Microsoft Copilot and Lovart.
Although AI capabilities are likely to improve, the principal educational value of the assignment currently lies in the process of interpreting and understanding the selected research paper.
In 2026, we encouraged students to use AI tools as learning aids to help interpret experimental methods and results, providing example prompts to support constructive use.
References
- Eppler MJ (2006). Information Visualization 5(3):202–210.
- Cox L (2015). Are graphical abstracts changing the way we publish? The Wiley Network. Read article.
- Ghosh R (2024). The chicken or egg problem – should publishers mandate graphical abstracts or let authors lead the way? The Scholarly Kitchen. Read article.
- Jambor HK, Bornhäuser M (2024). PLoS Computational Biology 20(2):e1011789.
- Lane S, Karatsolis A, Bui L (2015). In: Proceedings of the 33rd Annual International Conference on the Design of Communication. Gossett K, Mallory A, Armfield DM (Eds.), pp. 1–9. https://doi.org/10.1145/2775441.2775465.
About the Authors

Associate Professor Katrina Binger
Department of Biochemistry and Molecular Biology, Monash University.
katrina.binger@monash.edu
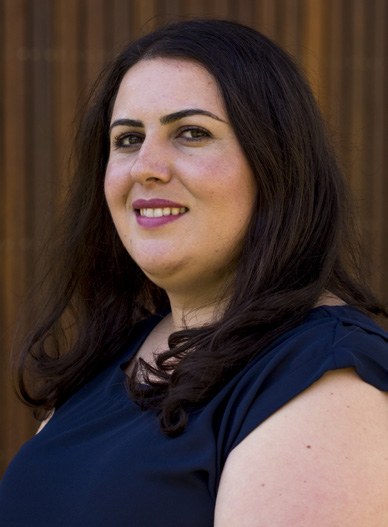
Dr Maria Demaria is a Senior Lecturer in the Department of Immunology, Monash University.
maria.demaria@monash.edu

Associate Professor Mark Wright
Department of Immunology, Monash University.
mark.wright@monash.edu
This article first appeared in the ASBMB Education Feature of Australian Biochemist, Vol 57 No 1, April 2026, pages 20–21.
ASBMB Membership Office
T +61 (03) 9907 8648
E asbmb@wsm.com.au
© 2026 ASBMB. All rights reserved.